How much money have OnMarket investors made from IPOs?
03 May 2019 @ 12:00am IPOs
In January 2018, I wrote a blog from the beach outlining a simple strategy that had produced pretty amazing returns over the previous 4 years. This Easter break I spent a bit of time in the bush.
There was no internet, mobile coverage or TV. And, I had a bit of time on my (soft-city) hands. It got me thinking, how has it gone for the people that read the blog and started the strategy at that point in time?
A quick recap. The strategy wasn’t complex. It involved:
- Investing the same amount in every OnMarket IPO; and
- Selling every OnMarket IPO at the same number of days post-listing.
In that blog, we calculated the returns for someone that sold every IPO 6 months after listing as their time-frame. Someone that had followed the strategy since inception earned a stellar 53% p.a. simple annualised return on money invested over the 4 years from October 2013 to January 2018. Or, in dollar terms, a person that invested $10,000 in each IPO earnt a profit of $202,855.
But, what about people that read the blog and then started the strategy?
The market has gone down, up, down again and back to where it started. US & China kicked off a trade war, Kim and Donald got friendly, while Britain and Europe didn’t, we drained the Murray-Darling River and wondered why the fish died, voted for marriage equality, ousted a PM and watched our cricketers put sandpaper in places that it doesn’t belong. Nothing unexpected really.
But, I digress. About that strategy.
Let’s say you read the blog in January 2018 and started the strategy. Since then, you would have earnt 32.52% pa simple annualised return. Or, in dollar terms, had you invested $10,000 in each IPO, selling after 6 months and reinvesting, as at 30 April 2019, you would have earnt profit of $48,197.
Your risk would have been diversified across 24 investments.
We understand that the profits come from only a few IPOs. So, if you are an investment guru and can predict which stocks are going to boom and which are going to bust then power to you, it’s a great skill to have. Magical even. For the rest of us mere mortals, earning 32.52% is pretty outstanding (especially when the small ords was only up 3.5% over the same period).
In case you are wondering, we do publish our performance figures (updated for 1st of every month) for all our deals and each component, since inception, for strategies for 1 day, 1 month, 3 months and 6 months selling periods. Look for “See comprehensive breakdown of returns”.
Since inception of OnMarket (and our prior infrastructure, ASX BookBuild) in October 2013, the simple annualised return for the same 6-month strategy to 30 April 2019 since inception is 39.93% pa.
Oh, of course, investing in IPOs is risky. Any journalist looking for a cliché, or financial planner looking for a hidden trailing commission on a financial product can tell you that. How have safe ‘blue chip’ investments fared over the same period?
- BHP (delivering a fair 7.26% pa)
- WOW (a menial 3.49% pa)
- NAB (a crumby 3.18% pa)
- TLS (a measly 2.27% pa)
- AMP (surprisingly you would have only lost 1.65% pa)
And, yes – we’ve included dividends (but not franking credits).
Or, perhaps ETFs are your thing. An investment in the S&P 200 ETF (ASX:STW) would have delivered you total return of 9.79% pa since October 2013.
One of our members put an interesting question to me. What about after scale-back for ‘hot’ offers? How does that affect performance? Well, it’s a bit more complex because the amount of scaleback depended on the size of your regular bid. An investor that applied for $2,000 in each IPO would never have been scaled back. That person would have earnt 39.93% pa since 2013. An investor that applied for $10,000 in each IPO would have earnt 31.56% pa (after accounting for scale-backs…i.e. in some IPOs they didn’t get the full amount they applied for).
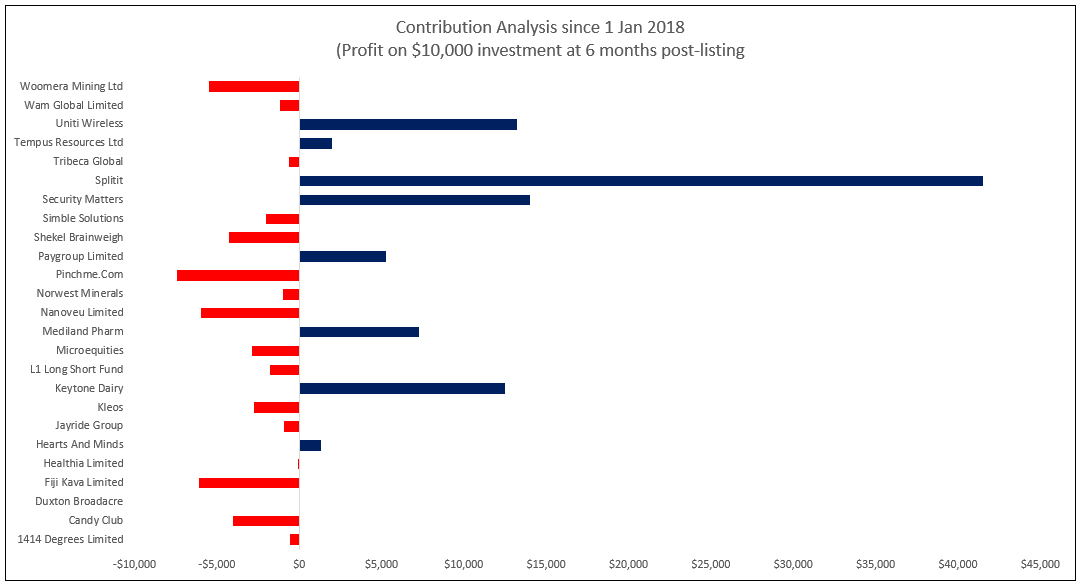
Where you would have made returns following this simple strategy:
Of course, as the regulations require us to say: ‘past performance is not a reliable indicator of future performance’. After all, this is only 5 years of data. And, you would have to believe that there is some systemic reason why IPOs are underpriced versus the aftermarket, such as to create a large liquidity event, and attract institutional investors into the IPO.
With 5 years of data, more than 100 IPOs, complete transparency over performance and analysis to boot, it might be time to question whether your current strategy has delivered, and to take action.
Cheers,
Ben
* Returns calculated using Sharesight. For more information on how returns are calculated, see the performance calculation methodology here.